Message: Return type of CI_Session_files_driver::open($save_path, $name) should either be compatible with SessionHandlerInterface::open(string $path, string $name): bool, or the #[\ReturnTypeWillChange] attribute should be used to temporarily suppress the notice
Message: Return type of CI_Session_files_driver::close() should either be compatible with SessionHandlerInterface::close(): bool, or the #[\ReturnTypeWillChange] attribute should be used to temporarily suppress the notice
Message: Return type of CI_Session_files_driver::read($session_id) should either be compatible with SessionHandlerInterface::read(string $id): string|false, or the #[\ReturnTypeWillChange] attribute should be used to temporarily suppress the notice
Message: Return type of CI_Session_files_driver::write($session_id, $session_data) should either be compatible with SessionHandlerInterface::write(string $id, string $data): bool, or the #[\ReturnTypeWillChange] attribute should be used to temporarily suppress the notice
Message: Return type of CI_Session_files_driver::destroy($session_id) should either be compatible with SessionHandlerInterface::destroy(string $id): bool, or the #[\ReturnTypeWillChange] attribute should be used to temporarily suppress the notice
Message: Return type of CI_Session_files_driver::gc($maxlifetime) should either be compatible with SessionHandlerInterface::gc(int $max_lifetime): int|false, or the #[\ReturnTypeWillChange] attribute should be used to temporarily suppress the notice
best bi consulting | bi consulting services | tableau consulting agencies
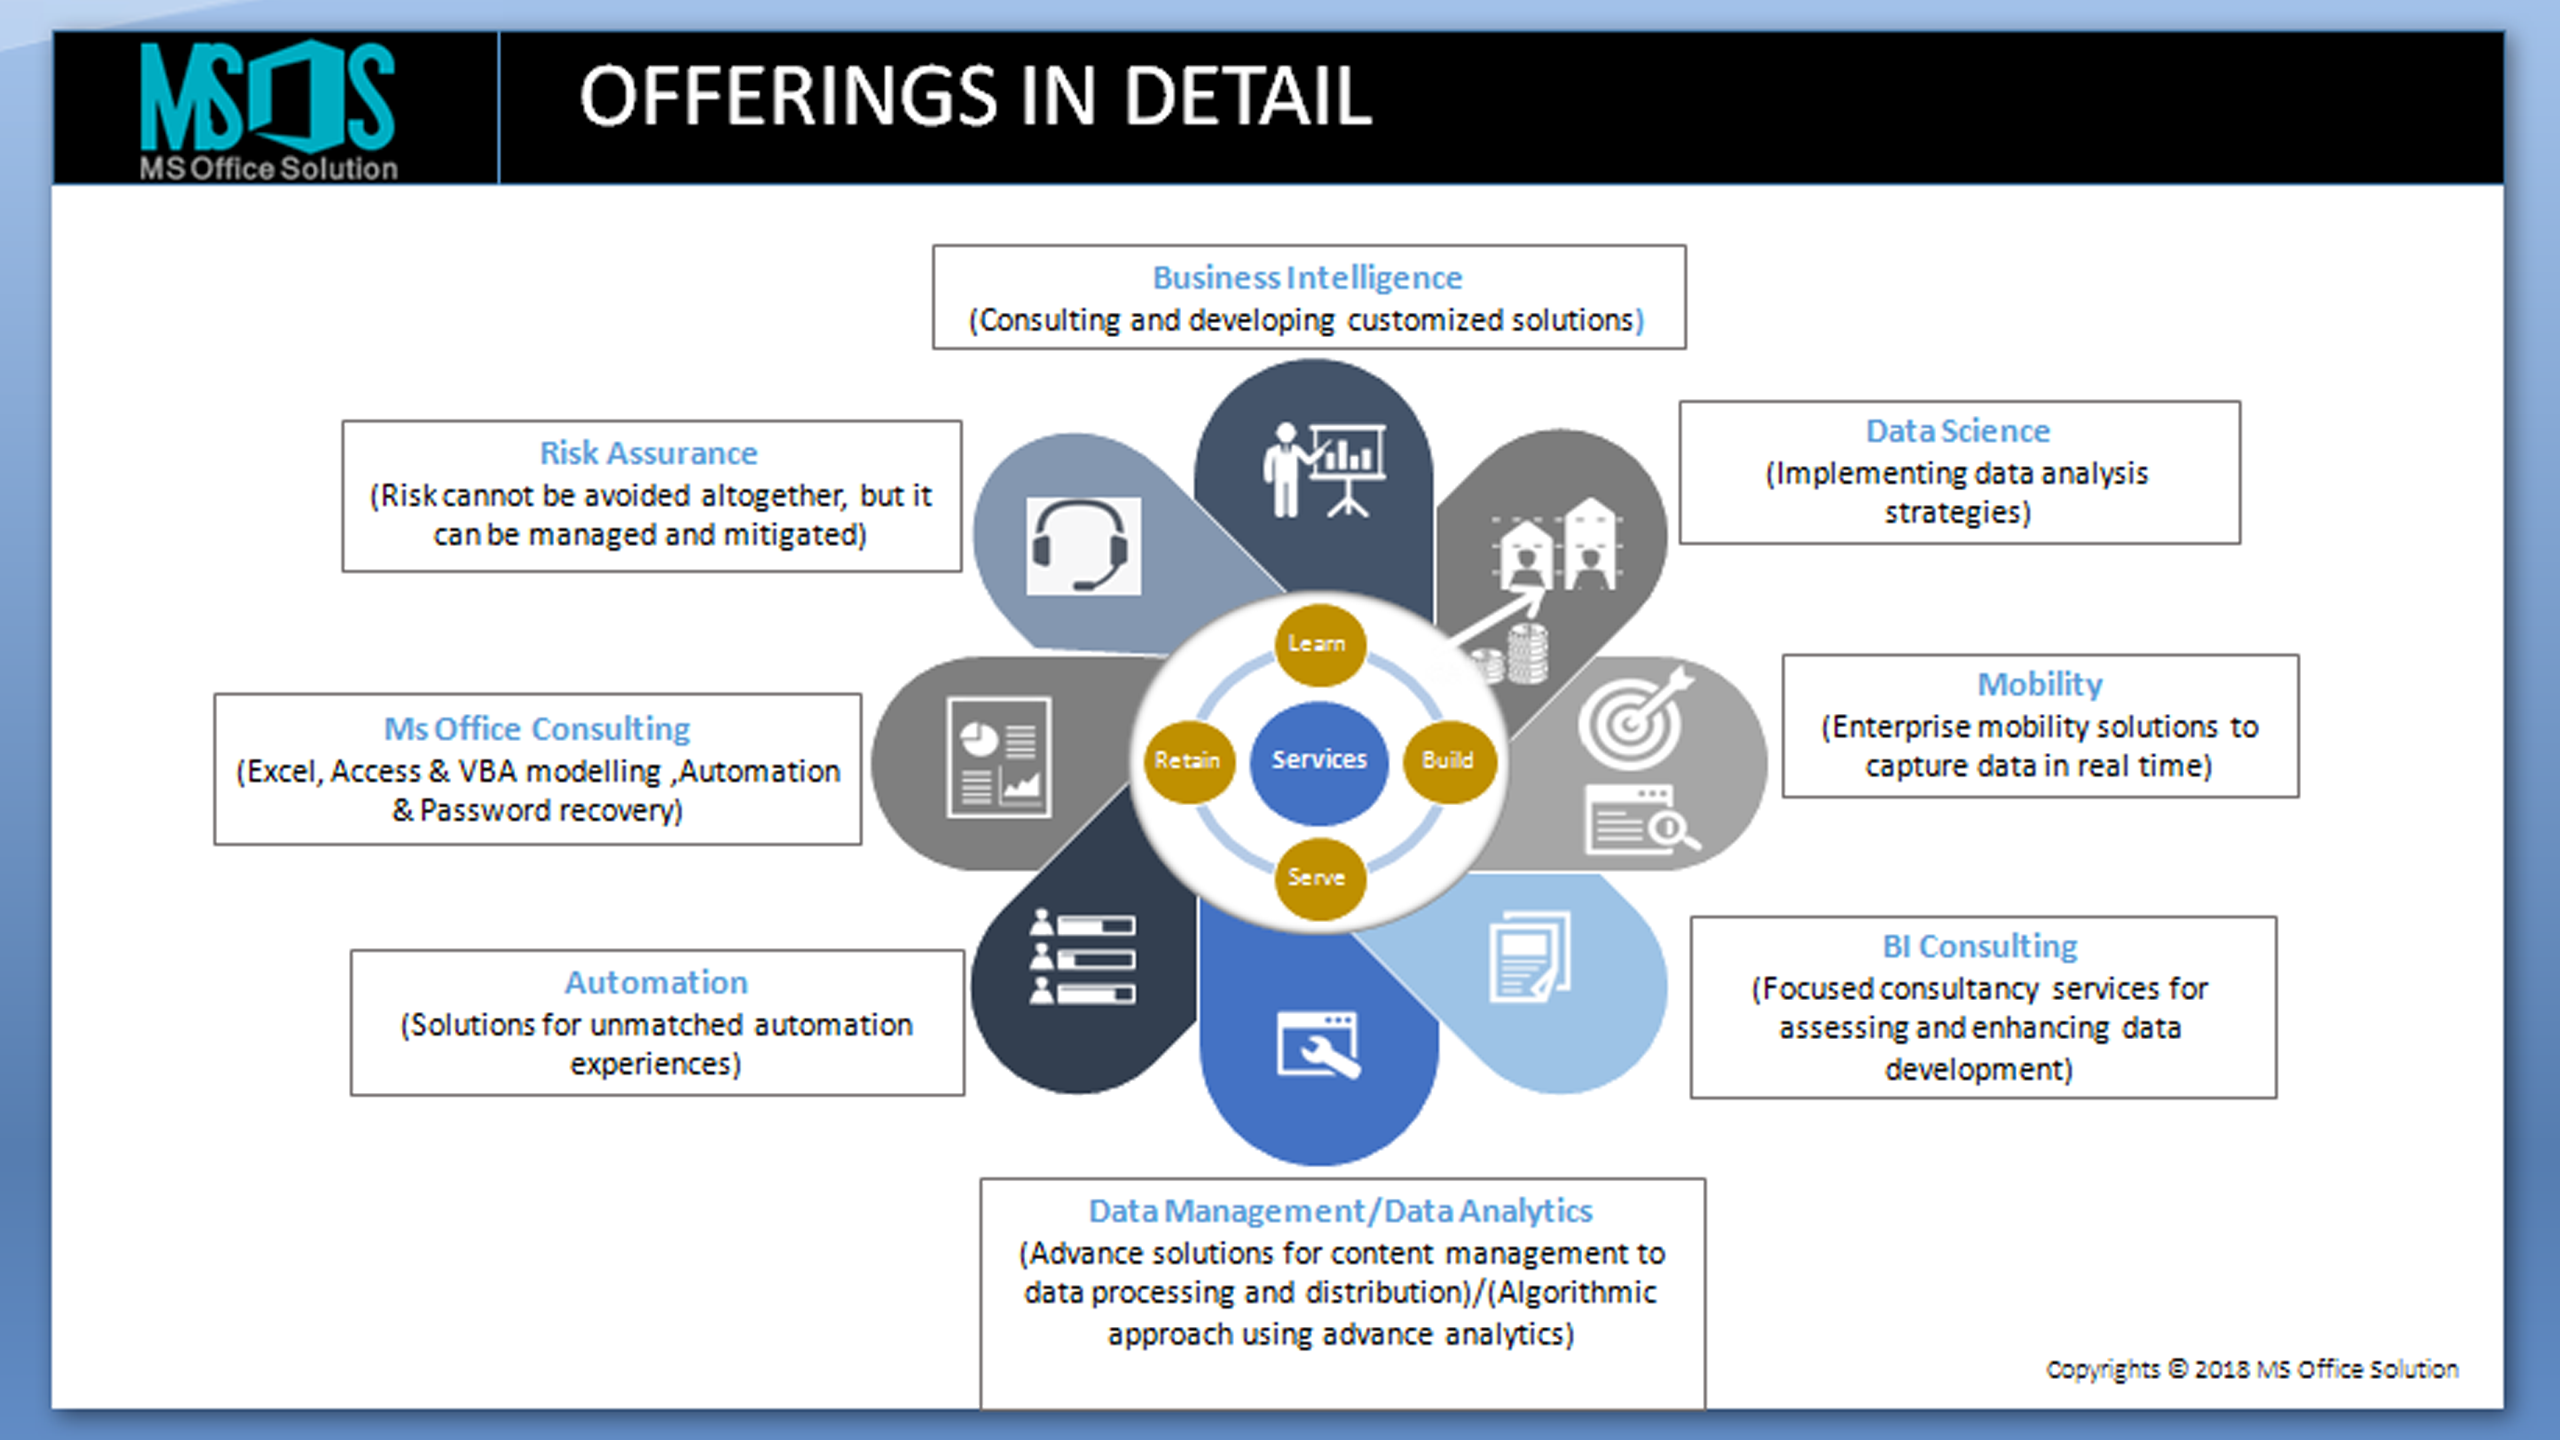
Business Intelligence Consulting
BI CONSULTING SERVICES
Digindia innovation’s business intelligence consulting services are instrumental in facilitating the execution of client organizations.We help our clients in selection of right tools to get best results as per the existing and future need of the client.
Our BI Consulting services include:
Business Process Optimization
BI Tool Selection
Need Analysis
Road Map Creation
Requirement Mapping
Implementation
Digindia innovation’s business intelligence consulting services provide companies and organizations, with minimal risk and a excess of options when it comes to business intelligence solutions through open technology based BI platforms such as Pentaho, Hadoop and MongoDB.As part of our consulting practice we offer an optimization service which helps in bridging the gaps between the desired and existing state of Business Intelligence Implementation in an organization or company
Value Add
Our all solutions comes with AI enbaled chat bot using which clients/customers can write questions and get answers immediatley we uses NLP based tehnology in backend
BI SOLUTIONS
Our BI services help organizations optimize their capabilities to hold various types of data and make it into something that business can use to make better and more informed choices.
Our Boxed Business Intelligence services include among others:
Tableau Services
Qlik Services
Klipfolio Services
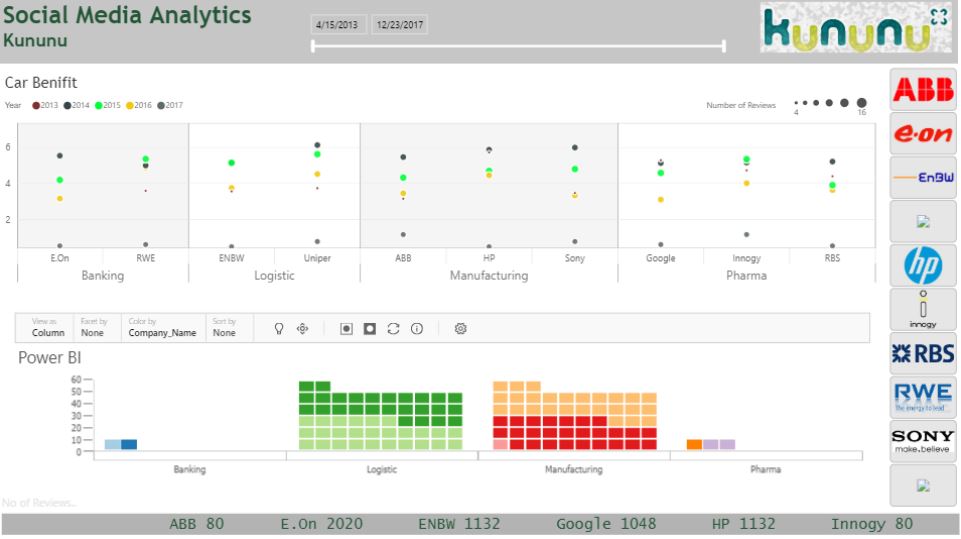
Power BI Services
Google Data Studio Services
When companies require business intelligence implementation and consulting assistance they can look no further than Digindia innovation. Weoffer Business Analytics and Intelligence services that can help your business to make rapid growth & improve business performance with accurate information.
BI Assessment: Capture existing business needs, evaluate all aspects for business applications such as application process, technology, requirements & infrastructure, identify the problem and provide roadmap for its solution
Every organization needs top management for their smooth and progressive functioning. Appointing a CEO is not an easy task; it requires lot of time and energy to understand various factors to choose the best fit. One of our client is struggling in making a decision to hire the CEO for their multi-ventures. Digindia innovation created a detailed dashboard to showcase the analysis on top 100 CEO’s from all over the world in different industry and domains.
We divided the entire solution into three parts:
First part is focused on overall ranking of CEO, companies they are associated with, average age & experience, gender etc.
Second slide showcase the list of top CEO’s all over the world along with their company & country details, to know the best industry serving in this field.
Last part talks about the change in market cap by company based on overall ranking of CEO.
Despite of having such critical information, the interface of the solution is so simple that it gives in-depth insights and helps the organization to take the right decision.
The dashboard has been created for one of the client using their data set to showcase national happiness of countries from various standpoints. The combination of metrics like economy, freedom, generosity, honesty, good governance etc. highlights the happiness score of a country. It’s an interactive and one-click solution that provides insights based on heat maps & bubble charts for different geography. We can filter the results and can see the real-time happiness score of each country in the range of 1 to 10.
These insights help to identify the most prominent area to be worked upon, in order to improve the overall growth and happiness index of a country. Norway is a very good example to showcase this, it was at 4th position in 2016 Word Happiness Report but in 2017 it has achieved top position in the list.So, we can use this report for trend analysis considering various metrics to penetrate on the most required area to improve the happiness score of a country.
Analytics Reporting Automation, Dashboard Development
MDM and Data Governance Guidance
BI Readiness assessment
BI Roadmap Planning
Tools & Technology Evaluation & Recommendation
BI Optimization
Define key data architecture decisions
Design engine for end-to-end traceability
Define key baseline against which the performance of the BI initiative can be measured
Designing BI Visualization – Power BI, Tableau, etc..
Report and Dashboard Development
Dashboard / Reporting / Analytics design and development
Ad-hoc reporting with BI
Conduct UAT
Release Dashboards and schedule for updates
Stakeholder expectations and Dashboard objectives
Business context and constraints
Tools and technology choices
Internal and external data sources
Envisaging outputs/dashboard
Exploratory data analysis
KPIs used in industry, best practices
Analyses and KPIs to address business problems
Stakeholder sign-off on KPIs
Refresh frequency decisions
Map data sources to target database
Data cleansing and consistency checks
Data transformations and KPI construction
Load data into the target database
Mock-ups and wireframes
Revise with stakeholders
Build dashboard prototype
Conduct User Acceptance Testing
Release dashboard and schedule for updates
Case Studies
Centralize real time application for insights
The challenge was to build a real-time dashboard and reporting solution that combined enterprise and external data including consumer and social media data in order to present a unified insight into an enterprise.
,
By cutting the time the user spent observing historical data, we were able to provide the ability to assess similar cases, as well as assess those cases that were similar in a particular way. Digindia innovation extended the capabilities of the application beyond the relationship between the machine and the user. In other words, we created the ability for the user to be able to collaborate with other SMEs. An interactive document was generated to keep annotations and other information from the application.
In the end, we enabled the SME to teach machines pattern recognition and solution identification through human insights and apply those patterns in real time. By
creating an interface that changed the way that experts worked, we were able to offer a universal solution that scaled across industries.
,
Sales Process Management & How BI imparts wisdom through the right analytic tool
A LEAD is the first element that changes its state through various operations and then culminates to a SALE. Leads that are successful stay with the company as customers who are followed later for further campaigns. The “lost” leads need to go through an alternate process where from some gains may come through,


Case Studies